

Net Revenue Retention
Report, Sept 2023 | State of the Industry High Performers vs. The Rest
Net Revenue Retention STATE OF THE INDUSTRY HIGH PERFORMERS VS. THE REST September 2023
KEY QUESTIONS In this report our goal was to provide a perspec琀椀ve on the following key ques琀椀ons contempla琀椀ng every SaaS and so昀琀ware Founder/CEO, leadership team, and Board of Directors. → What are the expecta琀椀ons for Net Revenue Reten琀椀on (NRR) in 2023? → What SaaS ver琀椀cals will have the best NRR performance? → How does growth mo琀椀on impact NRR performance? → What organiza琀椀on design delivers the best NRR performance? → How do pricing metrics impact NRR performance? PeakSpan & Ibbaka Net Revenue Reten琀椀on Research Report September 2023 2
EXECUTIVE SUMMARY Net Revenue Reten琀椀on (NRR also known as Net Dollar Reten琀椀on or NDR) is one of the best leading indicators of SaaS company performance. It is the amount of revenue that a company will generate from its exis琀椀ng customer base without adding any new customers. Investors and leadership teams are focusing on NRR as it measures the health of the customer base and predicts recurring revenue growth. Companies delivering NRR of more than 130 are seen as very good targets for investment. Those with an NRR of less than 90 will struggle to grow. In May and June of 2023, PeakSpan and Ibbaka partnered to survey the SaaS industry on NRR. Three hundred and forty- one (341) companies from a wide range of SaaS ver琀椀cals responded. PeakSpan & Ibbaka Net Revenue Reten琀椀on Research Report September 2023 3
This is a modal window.
KEY FINDINGS → Overall, NRR is expected to decline slightly from 2022 to 2023 → The top performing ver琀椀cals are Ar琀椀昀椀cial Intelligence and Data Analysis, but companies with high NRR can be found in virtually every ver琀椀cal → Companies with high NRR performance are focussed on growth (growing in package, upsell and cross sell) as they have already solved for churn → The most e昀昀ec琀椀ve way to manage NRR is with a dedicated team; the least e昀昀ec琀椀ve way is to rely on sales → Companies with hybrid pricing (two or more price metrics) outperform companies that rely on one price metric, especially if that metric is number of users ACTIONS TO TAKE 1. Address churn 2. Manage discoun琀椀ng 3. Design pricing metrics for growth in package 4. Design packaging to encourage upsell 5. Add cross sell opportuni琀椀es PeakSpan & Ibbaka Net Revenue Reten琀椀on Research Report September 2023 4
TABLE OF CONTENTS Execu琀椀ve Summary 3 Key Findings & Ac琀椀ons to Take 4 What is NRR? 7 The six NRR factors 8 Ac琀椀ons to take to improve NRR 9 Address churn 9 Manage discoun琀椀ng 9 Design pricing metrics for growth in package 10 Design packaging to encourage upsell 10 Add cross sell opportuni琀椀es 11 Key Insights 12 Overall, NRR performance will be slightly worse in 2023 12 NRR performance is diverging by ver琀椀cal 13 High Performers: AI and Data Analysis 14 Laggards: EdTech and HR 14 High performers are focussed on growth 15 NRR performance is be琀琀er when a dedicated team is responsible 17 Growth Mo琀椀on and NRR 18 NRR and Package Architecture 21 NRR by Target Market 22 NRR Performance by Pricing Metric 23 How do professional services revenues impact NRR? 25 PeakSpan & Ibbaka Net Revenue Reten琀椀on Research Report September 2023 5
This is a modal window.
Comparing the top performers with the worst performers 26 Con昀椀dence in projec琀椀ons 27 Target Market 28 Industry Ver琀椀cal 29 Growth Mo琀椀on 30 Package Architecture 31 Organiza琀椀on Design 32 Pricing Metric 33 NRR Lever 34 NRR Growth Lever Choices 35 Pricing metrics and NRR 37 Pricing metrics for AI 38 Pricing metrics for API Integrators 39 Survey Demographics 40 List of Figures and Tables 43 Resources 44 About PeakSpan 48 About Ibbaka 48 PeakSpan & Ibbaka Net Revenue Reten琀椀on Research Report September 2023 6
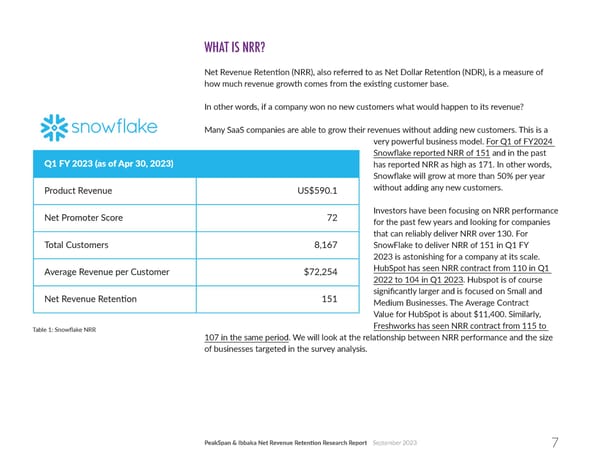
WHAT IS NRR? Net Revenue Reten琀椀on (NRR), also referred to as Net Dollar Reten琀椀on (NDR), is a measure of how much revenue growth comes from the exis琀椀ng customer base. In other words, if a company won no new customers what would happen to its revenue? Many SaaS companies are able to grow their revenues without adding new customers. This is a very powerful business model. For Q1 of FY2024 Snow昀氀ake reported NRR of 151 and in the past has reported NRR as high as 171. In other words, Snow昀氀ake will grow at more than 50% per year without adding any new customers. Investors have been focusing on NRR performance for the past few years and looking for companies that can reliably deliver NRR over 130. For SnowFlake to deliver NRR of 151 in Q1 FY 2023 is astonishing for a company at its scale. HubSpot has seen NRR contract from 110 in Q1 2022 to 104 in Q1 2023. Hubspot is of course signi昀椀cantly larger and is focused on Small and Medium Businesses. The Average Contract Value for HubSpot is about $11,400. Similarly, Freshworks has seen NRR contract from 115 to Table 1: Snow昀氀ake NRR 107 in the same period. We will look at the rela琀椀onship between NRR performance and the size of businesses targeted in the survey analysis. PeakSpan & Ibbaka Net Revenue Reten琀椀on Research Report September 2023 7
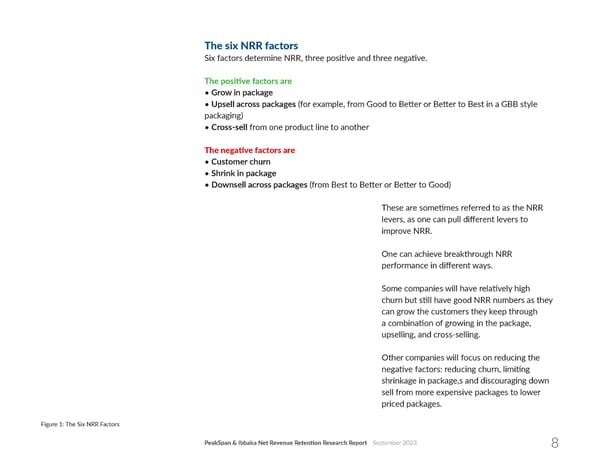
The six NRR factors Six factors determine NRR, three posi琀椀ve and three nega琀椀ve. The posi琀椀ve factors are •Grow in package •Upsell across packages (for example, from Good to Be琀琀er or Be琀琀er to Best in a GBB style packaging) •Cross-sell from one product line to another The nega琀椀ve factors are •Customer churn •Shrink in package •Downsell across packages (from Best to Be琀琀er or Be琀琀er to Good) These are some琀椀mes referred to as the NRR levers, as one can pull di昀昀erent levers to improve NRR. One can achieve breakthrough NRR performance in di昀昀erent ways. Some companies will have rela琀椀vely high churn but s琀椀ll have good NRR numbers as they can grow the customers they keep through a combina琀椀on of growing in the package, upselling, and cross-selling. Other companies will focus on reducing the nega琀椀ve factors: reducing churn, limi琀椀ng shrinkage in package,s and discouraging down sell from more expensive packages to lower priced packages. Figure 1: The Six NRR Factors PeakSpan & Ibbaka Net Revenue Reten琀椀on Research Report September 2023 8
ACTIONS TO TAKE TO IMPROVE NRR There is a natural order of opera琀椀ons to improving NRR that can be seen in the survey data. 1. Address churn 2. Manage discoun琀椀ng 3. Design pricing metrics for growth in package 4. Design packaging to encourage upsell 5. Add cross sell opportuni琀椀es Address churn Churn sucks growth out of the subscrip琀椀on model. With high churn, it is almost impossible to deliver NRR of more than 100, let alone reach Snow昀氀ake-like heights. Managing churn is the 昀椀rst priority in improving NRR performance. This does not mean that churn will be, or even could be zero. Every business has a natural level of churn and trying to drive churn below that number will have a diminishing return on investment. The natural rate of churn will depend on things like the rate of mergers, businesses closing down or changing business models, and the business cycle. That said, if your reten琀椀on is less than 90% a year, you have a problem that you need to address. If reten琀椀on is below the natural rate, you need to 昀椀x that with customer success, with product tweaks, and possibly with tac琀椀cs like reten琀椀on o昀昀ers. If you are at the natural level of reten琀椀on, and this is too low to build a sustainable business model, then you need to consider shi昀琀ing into a market with a higher natural reten琀椀on rate. Manage discoun琀椀ng Discoun琀椀ng is part of B2B and you may need to have discounts (some companies do not, see for example Chili Piper ‘We don’t o昀昀er discounts at Chili Piper. Ever’. But undisciplined or ad-hoc discoun琀椀ng can have a very bad impact on NRR. This connects back to churn, as companies with high churn o昀琀en have a lot of ad hoc discoun琀椀ng, as they try to save accounts. One has to have good control of discoun琀椀ng before taking other steps to improve NRR. →See SaaS discoun琀椀ng prac琀椀ces and pricing PeakSpan & Ibbaka Net Revenue Reten琀椀on Research Report September 2023 9
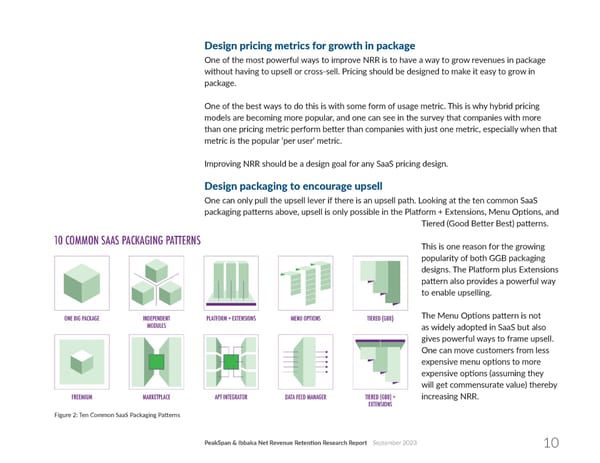
Design pricing metrics for growth in package One of the most powerful ways to improve NRR is to have a way to grow revenues in package without having to upsell or cross-sell. Pricing should be designed to make it easy to grow in package. One of the best ways to do this is with some form of usage metric. This is why hybrid pricing models are becoming more popular, and one can see in the survey that companies with more than one pricing metric perform be琀琀er than companies with just one metric, especially when that metric is the popular ‘per user’ metric. Improving NRR should be a design goal for any SaaS pricing design. Design packaging to encourage upsell One can only pull the upsell lever if there is an upsell path. Looking at the ten common SaaS packaging pa琀琀erns above, upsell is only possible in the Pla琀昀orm + Extensions, Menu Op琀椀ons, and Tiered (Good Be琀琀er Best) pa琀琀erns. This is one reason for the growing popularity of both GGB packaging designs. The Pla琀昀orm plus Extensions pa琀琀ern also provides a powerful way to enable upselling. The Menu Op琀椀ons pa琀琀ern is not as widely adopted in SaaS but also gives powerful ways to frame upsell. One can move customers from less expensive menu op琀椀ons to more expensive op琀椀ons (assuming they will get commensurate value) thereby increasing NRR. Figure 2: Ten Common SaaS Packaging Pa琀琀erns PeakSpan & Ibbaka Net Revenue Reten琀椀on Research Report September 2023 10
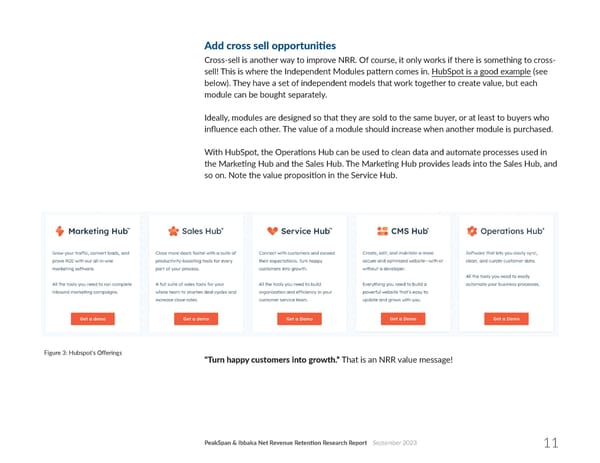
Add cross sell opportuni琀椀es Cross-sell is another way to improve NRR. Of course, it only works if there is something to cross- sell! This is where the Independent Modules pa琀琀ern comes in. HubSpot is a good example (see below). They have a set of independent models that work together to create value, but each module can be bought separately. Ideally, modules are designed so that they are sold to the same buyer, or at least to buyers who in昀氀uence each other. The value of a module should increase when another module is purchased. With HubSpot, the Opera琀椀ons Hub can be used to clean data and automate processes used in the Marke琀椀ng Hub and the Sales Hub. The Marke琀椀ng Hub provides leads into the Sales Hub, and so on. Note the value proposi琀椀on in the Service Hub. Figure 3: Hubspot’s O昀昀erings “Turn happy customers into growth.” That is an NRR value message! PeakSpan & Ibbaka Net Revenue Reten琀椀on Research Report September 2023 11
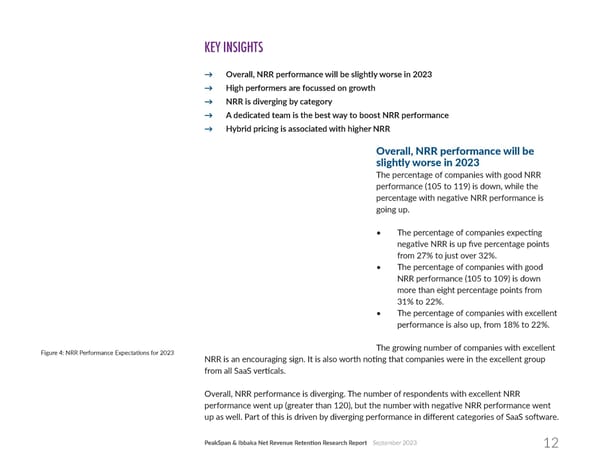
KEY INSIGHTS → Overall, NRR performance will be slightly worse in 2023 → High performers are focussed on growth → NRR is diverging by category → A dedicated team is the best way to boost NRR performance → Hybrid pricing is associated with higher NRR Overall, NRR performance will be slightly worse in 2023 The percentage of companies with good NRR performance (105 to 119) is down, while the percentage with nega琀椀ve NRR performance is going up. • The percentage of companies expec琀椀ng nega琀椀ve NRR is up 昀椀ve percentage points from 27% to just over 32%. • The percentage of companies with good NRR performance (105 to 109) is down more than eight percentage points from 31% to 22%. • The percentage of companies with excellent performance is also up, from 18% to 22%. The growing number of companies with excellent Figure 4: NRR Performance Expecta琀椀ons for 2023 NRR is an encouraging sign. It is also worth no琀椀ng that companies were in the excellent group from all SaaS ver琀椀cals. Overall, NRR performance is diverging. The number of respondents with excellent NRR performance went up (greater than 120), but the number with nega琀椀ve NRR performance went up as well. Part of this is driven by diverging performance in di昀昀erent categories of SaaS so昀琀ware. PeakSpan & Ibbaka Net Revenue Reten琀椀on Research Report September 2023 12
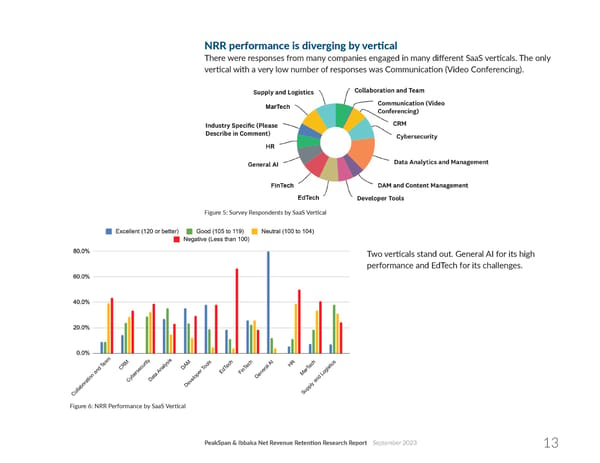
NRR performance is diverging by ver琀椀cal There were responses from many companies engaged in many di昀昀erent SaaS ver琀椀cals. The only ver琀椀cal with a very low number of responses was Communica琀椀on (Video Conferencing). Figure 5: Survey Respondents by SaaS Ver琀椀cal Two ver琀椀cals stand out. General AI for its high performance and EdTech for its challenges. Figure 6: NRR Performance by SaaS Ver琀椀cal PeakSpan & Ibbaka Net Revenue Reten琀椀on Research Report September 2023 13
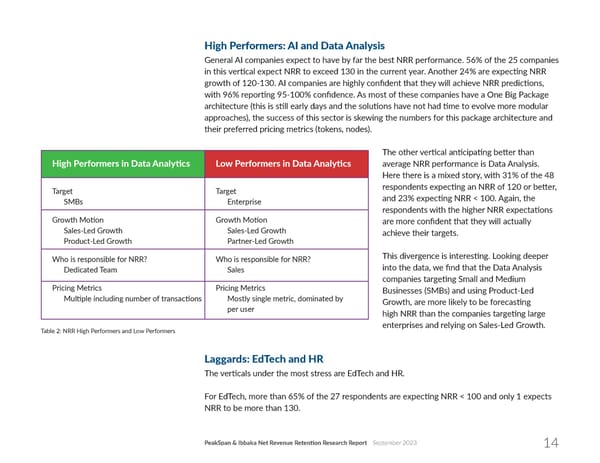
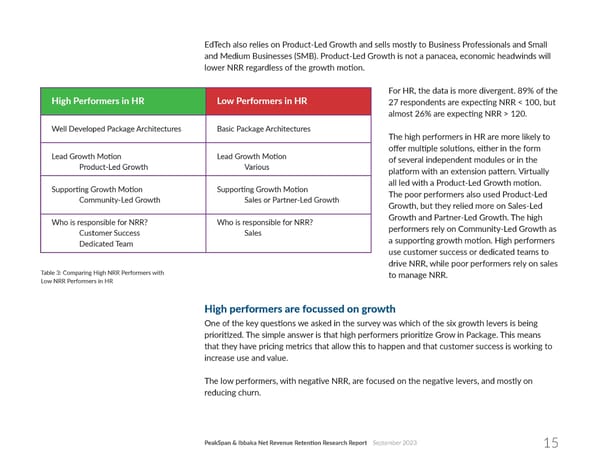
High Performers: AI and Data Analysis General AI companies expect to have by far the best NRR performance. 56% of the 25 companies in this ver琀椀cal expect NRR to exceed 130 in the current year. Another 24% are expec琀椀ng NRR growth of 120-130. AI companies are highly con昀椀dent that they will achieve NRR predic琀椀ons, with 96% repor琀椀ng 95-100% con昀椀dence. As most of these companies have a One Big Package architecture (this is s琀椀ll early days and the solu琀椀ons have not had 琀椀me to evolve more modular approaches), the success of this sector is skewing the numbers for this package architecture and their preferred pricing metrics (tokens, nodes). The other ver琀椀cal an琀椀cipa琀椀ng be琀琀er than average NRR performance is Data Analysis. Here there is a mixed story, with 31% of the 48 respondents expec琀椀ng an NRR of 120 or be琀琀er, and 23% expec琀椀ng NRR < 100. Again, the respondents with the higher NRR expecta琀椀ons are more con昀椀dent that they will actually achieve their targets. This divergence is interes琀椀ng. Looking deeper into the data, we 昀椀nd that the Data Analysis companies targe琀椀ng Small and Medium Businesses (SMBs) and using Product-Led Growth, are more likely to be forecas琀椀ng high NRR than the companies targe琀椀ng large enterprises and relying on Sales-Led Growth. Table 2: NRR High Performers and Low Performers Laggards: EdTech and HR The ver琀椀cals under the most stress are EdTech and HR. For EdTech, more than 65% of the 27 respondents are expec琀椀ng NRR < 100 and only 1 expects NRR to be more than 130. PeakSpan & Ibbaka Net Revenue Reten琀椀on Research Report September 2023 14
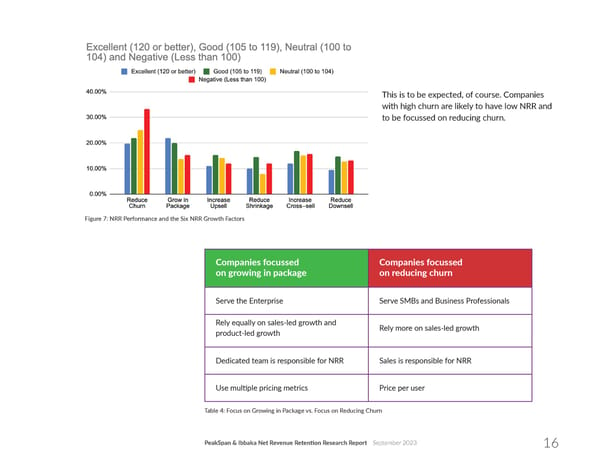
EdTech also relies on Product-Led Growth and sells mostly to Business Professionals and Small and Medium Businesses (SMB). Product-Led Growth is not a panacea, economic headwinds will lower NRR regardless of the growth mo琀椀on. For HR, the data is more divergent. 89% of the 27 respondents are expec琀椀ng NRR < 100, but almost 26% are expec琀椀ng NRR > 120. The high performers in HR are more likely to o昀昀er mul琀椀ple solu琀椀ons, either in the form of several independent modules or in the pla琀昀orm with an extension pa琀琀ern. Virtually all led with a Product-Led Growth mo琀椀on. The poor performers also used Product-Led Growth, but they relied more on Sales-Led Growth and Partner-Led Growth. The high performers rely on Community-Led Growth as a suppor琀椀ng growth mo琀椀on. High performers use customer success or dedicated teams to drive NRR, while poor performers rely on sales Table 3: Comparing High NRR Performers with to manage NRR. Low NRR Performers in HR High performers are focussed on growth One of the key ques琀椀ons we asked in the survey was which of the six growth levers is being priori琀椀zed. The simple answer is that high performers priori琀椀ze Grow in Package. This means that they have pricing metrics that allow this to happen and that customer success is working to increase use and value. The low performers, with nega琀椀ve NRR, are focused on the nega琀椀ve levers, and mostly on reducing churn. PeakSpan & Ibbaka Net Revenue Reten琀椀on Research Report September 2023 15
This is to be expected, of course. Companies with high churn are likely to have low NRR and to be focussed on reducing churn. Figure 7: NRR Performance and the Six NRR Growth Factors Table 4: Focus on Growing in Package vs. Focus on Reducing Churn PeakSpan & Ibbaka Net Revenue Reten琀椀on Research Report September 2023 16
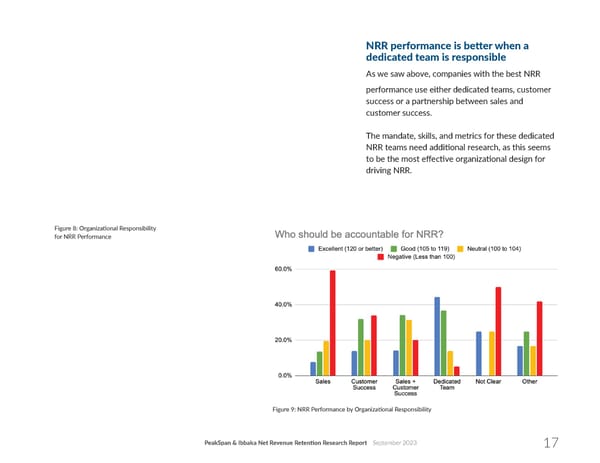
NRR performance is be琀琀er when a dedicated team is responsible As we saw above, companies with the best NRR performance use either dedicated teams, customer success or a partnership between sales and customer success. The mandate, skills, and metrics for these dedicated NRR teams need addi琀椀onal research, as this seems to be the most e昀昀ec琀椀ve organiza琀椀onal design for driving NRR. Figure 8: Organiza琀椀onal Responsibility for NRR Performance Figure 9: NRR Performance by Organiza琀椀onal Responsibility PeakSpan & Ibbaka Net Revenue Reten琀椀on Research Report September 2023 17
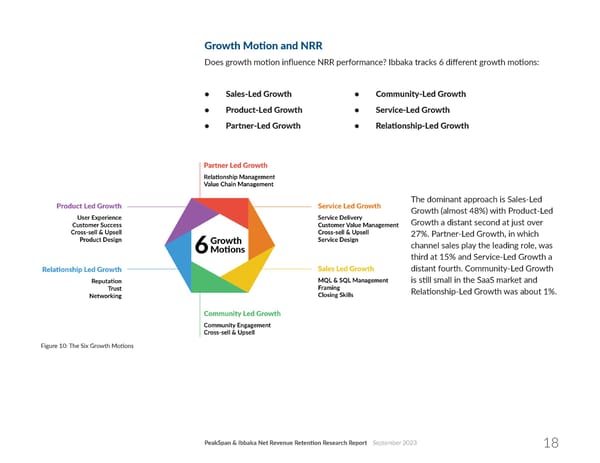
Growth Mo琀椀on and NRR Does growth mo琀椀on in昀氀uence NRR performance? Ibbaka tracks 6 di昀昀erent growth mo琀椀ons: • Sales-Led Growth • Community-Led Growth • Product-Led Growth • Service-Led Growth • Partner-Led Growth • Rela琀椀onship-Led Growth The dominant approach is Sales-Led Growth (almost 48%) with Product-Led Growth a distant second at just over 27%. Partner-Led Growth, in which channel sales play the leading role, was third at 15% and Service-Led Growth a distant fourth. Community-Led Growth is s琀椀ll small in the SaaS market and Rela琀椀onship-Led Growth was about 1%. Figure 10: The Six Growth Mo琀椀ons PeakSpan & Ibbaka Net Revenue Reten琀椀on Research Report September 2023 18
Given this distribu琀椀on, it is Product-Led Growth, Sales-Led Growth, and Partner-Led Growth that we are most concerned with. In general, Product-Led Growth outperforms Sales-Led Growth. Partner-Led Growth has some strong performers but has an equal number of companies with nega琀椀ve NRR. Figure 11: Distribu琀椀on of Primary Growth Mo琀椀ons in Survey Figure 12: NRR Performance by Growth Mo琀椀on PeakSpan & Ibbaka Net Revenue Reten琀椀on Research Report September 2023 19
Table 5: Product-Led Growth vs. Sales-Led Growth PeakSpan & Ibbaka Net Revenue Reten琀椀on Research Report September 2023 20
NRR and Package Architecture The most common package architecture is a set of independent modules, followed by Good Be琀琀er Best, and then Pla琀昀orm with Extensions and One Package. A small number of companies are using Data Feed Manager or API Integrator pa琀琀erns. Most of the rapidly growing AI companies are early in their evolu琀椀on and have not yet developed more modularized product architectures. They tend to use the One Package pa琀琀ern. Figure 13: Distribu琀椀on of Package Architectures in Survey Figure 14: NRR Performance and Packaging Architecture PeakSpan & Ibbaka Net Revenue Reten琀椀on Research Report September 2023 21
NRR by Target Market There is a good distribu琀椀on of target markets and most are in PeakSpan and Ibbaka’s focus area of B2B and B2G. Almost 16% of respondents target business professionals, which have characteris琀椀cs of both B2B and B2C markets. Figure 15: NRR by Target Market in Survey Figure 16: NRR Performance by Target Market PeakSpan & Ibbaka Net Revenue Reten琀椀on Research Report September 2023 22
NRR Performance by Pricing Metric Many pricing metrics are now used in SaaS pricing and many companies (more than 60% of the companies in this survey) now use two or more pricing metrics, in other words, they prac琀椀ce hybrid pricing. That said, per-user and per-ac琀椀ve-user pricing metrics s琀椀ll dominate in SaaS, followed by transac琀椀onal pricing (pricing based on either the number of transac琀椀ons or the value of transac琀椀ons). One is beginning to see the emergence of pricing metrics associated with AI, where pricing is o昀琀en metered using tokens. Nodes connected is a pricing metric used mainly by companies in the API space. Despite the popularity of usage-based pricing as a theme among Figure 17: Distribu琀椀on of Pricing Metrics in Survey pricing experts, it is actually used by less than 10% of the companies in this survey. The most popular pricing metric, per user, is also the least successful when measured by NRR performance. Per ac琀椀ve user pricing, though less common, performs much be琀琀er on NRR. This is interes琀椀ng, as ac琀椀ve user pricing tends to (i) have more varia琀椀on as the number of ac琀椀ve users can vary, and (ii) win higher prices as only people actually using the so昀琀ware are paying for it. PeakSpan & Ibbaka Net Revenue Reten琀椀on Research Report September 2023 23
Usage-based pricing does appear to contribute to NRR performance, with excellent and good NRR performance (20%) higher than neutral or nega琀椀ve NRR performance (16%). The use of tokens performs very well, but this re昀氀ects the growth stage of AI applica琀椀ons and should not be interpreted as companies needing to add a per-token pricing metric, even for their genera琀椀ve AI innova琀椀ons. A good pricing metric tracks the economic value provided. This is why per ac琀椀ve user, usage- based pricing and transac琀椀onal pricing metrics tend to outperform other metrics. Figure 18: NRR Performance by Pricing Metric PeakSpan & Ibbaka Net Revenue Reten琀椀on Research Report September 2023 24
How do professional services revenues impact NRR? Companies serving enterprises and government are more reliant on professional services than those serving SMBs and business professionals (this is common sense, but it is a good test of a survey to see if it is con昀椀rming common sense). Figure 19: Professional Services Contribu琀椀on by Target Market Figure 20: NRR Performance by Professional Service Contribu琀椀on PeakSpan & Ibbaka Net Revenue Reten琀椀on Research Report September 2023 25
COMPARING THE TOP PERFORMERS WITH THE WORST PERFORMERS One of the best ways to understand the di昀昀erences in NRR performance is to compare the best performers with the worst performers. In the following table and 昀椀gures we compare the top two 琀椀ers (NRR > 130 and NRR of 120 to 129) with the worst performers (NRR 90 to 94 and NRR < 90). This is not a causal analysis. There are many confounding variables to consider. For example, companies in EdTech tended to have low NRR performance and tended to use a per-user pricing metric. These companies would not necessarily improve their performance by changing pricing metrics (although adding a usage-based or performance-based metric could help some of these companies). AI companies are performing very well and o昀琀en use tokens as a pricing metric (Tokens are the basic units of text or code that an LLM AI uses to process and generate language. Tokens can be characters, words, subwords, or other segments of text or code, depending on the chosen tokeniza琀椀on method or scheme.) Non-AI companies do not really have this metric available and in many cases, this is a poor metric as it does not track value. The key di昀昀erences between high performers and low performers are as follows. Table 6: Characteris琀椀cs of High vs. Low NRR Performers PeakSpan & Ibbaka Net Revenue Reten琀椀on Research Report September 2023 26
Con昀椀dence in Projec琀椀ons Companies with high NRR projec琀椀ons for the current year tend to be much more con昀椀dent. They are more focused on NRR, track each of the six NRR factors, and are choiceful about which factors they are trying to improve. Comparing the top NRR performers with the lowest NRR performers - by Con昀椀dence in Projections Figure 21: Con昀椀dence in NRR Projec琀椀ons for High and Low Performers PeakSpan & Ibbaka Net Revenue Reten琀椀on Research Report September 2023 27
Target market B2B Companies that underperform on NRR tend to serve Small and Medium Businesses, Business Professionals, and the government (B2G). Companies with superior NRR performance can be found in all markets. Comparing the top NRR performers with the lowest NRR performers - by Target Market Figure 22: NRR Performance by Target Market PeakSpan & Ibbaka Net Revenue Reten琀椀on Research Report September 2023 28
Industry Ver琀椀cal The star NRR performers in 2023 are the Data Analysis and AI companies, but top performers can be found in most ver琀椀cals. There are even some EdTech and HR companies among the top performers. The under performers are in EdTech, HR, and Digital Asset Management. Comparing the top NRR performers with the lowest NRR performers - by Industry Vertical Figure 23: NRR Performance by Industry Ver琀椀cal PeakSpan & Ibbaka Net Revenue Reten琀椀on Research Report September 2023 29
Growth Mo琀椀on Product-Led Growth modestly outperforms Sales-Led Growth. Partner-Led Growth (companies that sell through partners) has a bimodal distribu琀椀on, with some companies performing well but others expec琀椀ng nega琀椀ve NRR. Comparing the top NRR performers with the lowest NRR performers - by Growth Motion Figure 24: NRR Performance by Growth Mo琀椀on PeakSpan & Ibbaka Net Revenue Reten琀椀on Research Report September 2023 30
Package Architecture The strong performance of AI and API integrator companies is skewing the results here. Generally speaking, packaging pa琀琀erns that provide opportuni琀椀es for upselling perform the best: Pla琀昀orm with Extensions and one of the 昀氀avors of Good Be琀琀er Best. There were a few SaaS companies using the Menu pa琀琀ern. Comparing the top NRR performers with the lowest NRR performers - by Package Architecture Figure 25: NRR Performance by Package Architecture PeakSpan & Ibbaka Net Revenue Reten琀椀on Research Report September 2023 31
Organiza琀椀on Design A dedicated team, responsible for NRR performance, is the best organiza琀椀onal design. If this is not possible, a partnership between sales and customer success can also work well, as can making customer success responsible for NRR. The least successful approach is to have sales responsible, though even here, there are some companies with excellent NRR performance where sales are responsible. Comparing the top NRR performers with the lowest NRR performers - by Organization Design Figure 26: NRR Performance by Organiza琀椀on Design PeakSpan & Ibbaka Net Revenue Reten琀椀on Research Report September 2023 32
Pricing Metric The AI-associated pricing metric per token, the number and value of transac琀椀ons, and usage- based pricing are all associated with higher NRR performance. Per-user pricing metrics are associated with poor NRR performance, in part because they are used in the HR and EdTech ver琀椀cals which are expected to underperform this year. The key to success appears to be to have more than one pricing metric and to have one pricing metric that is stable (like per-user pricing) and one pricing metric that is more variable, like the number or value of transac琀椀ons or a usage-based metric. Comparing the top NRR performers with the lowest NRR performers - by Pricing Metric Figure 27: NRR Performance by Pricing Metric PeakSpan & Ibbaka Net Revenue Reten琀椀on Research Report September 2023 33
NRR Lever The strong NRR performers are more focused on increasing upsell and on growing in package (two of the posi琀椀ve levers). The weak performers are primarily focused on reducing churn and then on reducing shrinkage in package. This does not mean that you win by ignoring churn. The strong performers have already dealt with churn and moved to work on the posi琀椀ve growth levers. Comparing the top NRR performers with the lowest NRR performers - by NRR Lever Figure 28: NRR Performance and NRR Growth Levers PeakSpan & Ibbaka Net Revenue Reten琀椀on Research Report September 2023 34
NRR GROWTH LEVER CHOICES One cannot focus on improving all six NRR growth factors at the same 琀椀me. In the opening sec琀椀on on ‘Ac琀椀ons to take to improve NRR’ we proposed an order of opera琀椀ons for these levers. 1. Address churn 2. Manage discoun琀椀ng 3. Design pricing metrics for growth in package 4. Design packaging to encourage upsell 5. Add cross-sell opportuni琀椀es Let’s look at the data and see what companies are actually priori琀椀zing. Beginning with the three posi琀椀ve factors, let’s work through all the alterna琀椀ves. → The highest-performing companies have this pa琀琀ern. (Seen with 30 companies.) + Increase upsell + Grow in package + Increase cross-sell — Reduce churn — Reduce down-sell — Reduce shrinkage in package This pa琀琀ern is also associated with high performance. → (Seen with 91 companies.) + Grow in package + Increase upsell — Reduce churn + Increase cross-sell — Reduce shrinkage in package — Reduce down-sell PeakSpan & Ibbaka Net Revenue Reten琀椀on Research Report September 2023 35
The following pa琀琀ern was not common. → (Seen with 55 companies.) + Increase cross-sell + Grow in package + Increase upsell — Reduce churn — Reduce shrinkage in package — Reduce down-sell → The most common pa琀琀ern led by a nega琀椀ve NRR factor was also associated with sub par performance (not because you should not address churn, but because the companies have a problem with churn). (Seen with 156 companies.) — Reduce churn + Increase upsell + Grow in package + Increase cross-sell — Reduce shrinkage — Reduce down-sell The following pa琀琀ern was seen mostly with low-performing companies, using Sales-Led → Growth, selling B2G. (Seen with 5 companies.) — Reduce shrinkage — Reduce churn + Increase cross-sell + Grow in package + Increase upsell — Reduce down-sell PeakSpan & Ibbaka Net Revenue Reten琀椀on Research Report September 2023 36
The least common pa琀琀ern. → (Seen with 4 companies.) — Reduce down-sell — Reduce shrinkage in package — Reduce churn + Grow in package + Increase upsell + Increase cross-sell NRR growth lever choices are a key part of any growth strategy. The choice will depend on the problems that must be addressed (beginning with churn), followed by those with the largest upside. Choose a package architecture that will give you the most op琀椀ons to improve NRR. PRICING METRICS AND NRR Pricing metrics have been a key focus of pricing design over the last few years. A pricing metric is: The unit of consump琀椀on for which a buyer pays. It is contrasted with the value metric. The unit of consump琀椀on by which a user gets value. In value-based pricing, one looks for pricing metrics that track value metrics. The SaaS industry is making slow progress toward this. The most common pricing metric remains per user (see Figure 17 above). This is where the early SaaS companies like Salesforce began and it has become the default. See Ibbaka’s User pricing metrics update published in July 2023. We are seeing more and more di昀昀erent pricing metrics in SaaS, and, as important, more and more companies using hybrid pricing where two or more pricing metrics are in play. One of the 昀椀ndings of this survey is that companies with two or more pricing metrics have be琀琀er NRR performance. Several new pricing metrics surfaced in this survey, associated with AI and with API integra琀椀ons. PeakSpan & Ibbaka Net Revenue Reten琀椀on Research Report September 2023 37
Pricing metrics for AI AI solu琀椀ons use the following pricing metrics. There is a great variety here, but the most common metrics are based on tokens. Open.ai explains tokens as follows: “You can think of tokens as pieces of words used for natural language processing. For English text, 1 token is approximately 4 characters or 0.75 words. As a point of reference, the collected works of Shakespeare are about 900,000 words or 1.2M tokens.” There were a large number of ‘Other’ responses. The most common of the other responses are pricing by model and custom pricing design for each customer. Figure 29: Pricing Metrics used in AI PeakSpan & Ibbaka Net Revenue Reten琀椀on Research Report September 2023 38
Pricing Metrics for API Integrators Another emerging SaaS business model is API integra琀椀on. Examples of this are Muleso昀琀, Zapier, and Gravitee.io. Major cloud providers also have solu琀椀ons like Apigee from Google and Microso昀琀 Azure API management. Many di昀昀erent pricing metrics are at play here as well. The number of nodes connected is the most common pricing metric, with the number of transac琀椀ons a close second. When the value of transac琀椀ons is added to the number of transac琀椀ons, transac琀椀on-based pricing has a slight edge. API integrators are also one of the leading ver琀椀cals when it comes to the adop琀椀on of usage metrics. Figure 30: Pricing Metrics for API Integra琀椀on PeakSpan & Ibbaka Net Revenue Reten琀椀on Research Report September 2023 39
SURVEY DEMOGRAPHICS The survey was conducted in May and June of 2023. Responses were solicited through direct email by PeakSpan and Ibbaka and through promo琀椀on at webinars and on LinkedIn. The results are biased by the community that could be reached. It is possible that companies with higher NRR performance were more likely to respond, and as a result, this overstates NRR performance in the general SaaS market. There were a total of 341 responses. B2B SaaS is generally divided into the following market targets: • B2B Business Professionals (individuals who are buying for professional reasons) 67 respondents • B2B Small and Medium Sized Businesses (SMB some琀椀mes referred to as SME with the E for Enterprise) 119 respondents • B2B Enterprise (in SaaS this includes rela琀椀vely small businesses with revenues > US$1 Billion and in some cases smaller) 114 respondents • B2B All 88 respondents • B2G Business to Government 60 respondents Figure 31: Market Targets of Survey Respondents • M2M Machine to Machine (An emerging category ) 14 respondents • B2C 9 respondents PeakSpan & Ibbaka Net Revenue Reten琀椀on Research Report September 2023 40
Respondents came from a wide range of SaaS ver琀椀cals. We did not collect informa琀椀on on geography, but will add this in future surveys. Figure 32: SaaS Ver琀椀cals of Survey Respondents There is a wide range of annual recurring revenue (ARR) with growth stage companies domina琀椀ng (ARR of $3 million to $50 million). This re昀氀ects the companies in PeakSpan’s por琀昀olio and the companies that Ibbaka serves Figure 33:ARR of Survey Respondents PeakSpan & Ibbaka Net Revenue Reten琀椀on Research Report September 2023 41
Figure 34: Roles of Survey Respondents PeakSpan & Ibbaka Net Revenue Reten琀椀on Research Report September 2023 42
LIST OF FIGURES AND TABLES Figures Figure 25: NRR Performance by Package Architecture Figure 1: The Six NRR Factors Figure 26: NRR Performance by Organiza琀椀on Design Figure 2: Ten Common SaaS Packaging Pa琀琀erns Figure 27: NRR Performance by Pricing Metric Figure 3: Hubspot’s O昀昀erings Figure 28: NRR Performance and NRR Growth Levers Figure 4: NRR Performance Expecta琀椀ons for 2023 Figure 29: Pricing Metrics used in AI Figure 5: Survey Respondents by SaaS Ver琀椀cal Figure 30: Pricing metrics for API Integra琀椀on Figure 6: NRR Performance by SaaS Ver琀椀cal Figure 31: Market Targets of Survey Respondents Figure 7: NRR Performance and the Six NRR Growth Factors Figure 32: SaaS Ver琀椀cals of Survey Respondents Figure 8: Organiza琀椀onal Responsibility for NRR Performance Figure 33: ARR of Survey Respondents Figure 9: NRR Performance by Organiza琀椀onal Responsibility Figure 34: Roles of Survey Respondents Figure 10: The Six Growth Mo琀椀ons Figure 11: Distribu琀椀on of Primary Growth Mo琀椀ons in Survey Tables Figure 12: NRR Performance by Growth Mo琀椀on Table 1: Snow昀氀ake NRR Figure 13: Distribu琀椀on of Package Architectures in Survey Table 2: NRR High Performers and Low Performers Figure 14: NRR Performance and Packaging Architecture Table 3: Comparing High NRR Performers with Low NRR Figure 15: NRR by Target Market in Survey Performers in HR Figure 16: NRR Performance by Target Market Table 4: Focus on Growing in Package vs. Focus on Reducing Churn Figure 17: Distribu琀椀on of Pricing Metrics in Survey Table 5: Product-Led Growth vs. Sales-Led Growth Figure 18: NRR Performance by Pricing Metric Table 6: Characteris琀椀cs of High vs. Low NRR Performers Figure 19: Professional Services Contribu琀椀on by Target Market Figure 20: NRR Performance by Professional Service Contribu琀椀on Figure 21: Con昀椀dence in NRR Projec琀椀ons for High and Low Performers Figure 22: NRR Performance by Target Market Figure 23: NRR Performance by Industry Ver琀椀cal Figure 24: NRR Performance by Growth Mo琀椀on PeakSpan & Ibbaka Net Revenue Reten琀椀on Research Report September 2023 43
Minimize Churn and Boost Your Net Dollar Reten琀椀on (Podcast Run琀椀me: 33 Minutes) In this episode with Mark S琀椀ving from Impact Pricing, Karen Chiang discusses the importance of linking your pricing to value and crea琀椀ng pricing packages that accurately re昀氀ect the value provided to consumers. They delve into the importance of net dollar reten琀椀on for assessing opera琀椀onal revenue and customer rela琀椀onships while exploring the art of packaging by seamlessly aligning value with pricing. Dive into the levers of net dollar reten琀椀on to unveil the genuine value your customers are in search of while eleva琀椀ng your comprehension and re昀椀ning your strategy for enduring success. Checklist for Pricing and Net Dollar Reten琀椀on (Downloadable Checklist) Net Dollar Reten琀椀on is a key metric that investors are tracking, given today’s current market condi琀椀ons. This checklist will able you to use pricing to improve net dollar reten琀椀on. Gain key takeaways so you can take ac琀椀on at your respec琀椀ve companies. BLOG ARTICLE RESOURCES Priori琀椀zing NDR Growth Choices In the 昀椀nal installment of our comprehensive explora琀椀on of Net Dollar Reten琀椀on (NDR), or Net Revenue Reten琀椀on (NRR), we delve into the cri琀椀cal strategies and pa琀琀erns that drive success. Spanning eight enlightening posts, we began with an overview of NDR’s signi昀椀cance in op琀椀mizing SaaS performance, followed by a thorough examina琀椀on of the six key levers you can harness to achieve your NDR objec琀椀ves, focusing on posi琀椀ve enhancements and reducing nega琀椀ve factors. NDR Growth Tac琀椀cs 6: Managing Churn The sixth NDR lever is churn management. Churn is the great enemy of SaaS businesses and understanding why churn is happening and how to reduce it is a cri琀椀cal part of managing a SaaS business. Churn is the denominator in the equa琀椀on for customer life琀椀me value. PeakSpan & Ibbaka Net Revenue Reten琀椀on Research Report September 2023 45
NDR Growth Tac琀椀cs 5: Reduce Package Downsell The 昀椀昀琀h NDR lever is reducing down-sell, where customers move from a more expensive to a less expensive package. How can one avoid this, or at least minimize the impact? We explore this challenge here. NDR Growth Tac琀椀cs 4: Avoid Package Shrinkage The fourth NDR lever is avoiding, or minimizing, package shrinkage. One thing that can reduce NDR is a reduc琀椀on in revenue from an exis琀椀ng package. What can we do to eliminate, or at least minimize package shrinkage? NDR Growth Tac琀椀cs 3: Promote Cross-Sell The third NDR level is to promote cross-sell. NDR applies at the customer level so cross-selling will improve NDR. Cross-sell can include both value-added services and addi琀椀onal product lines. Both can have a big impact on revenue and pro昀椀tability. NDR Growth Tac琀椀cs 2: Drive Upsell Companies op琀椀mizing NDR have six levers to pull, three posi琀椀ve, and three nega琀椀ve. In this post we look at the second of the posi琀椀ve levers: driving upsell across packages. NDR Growth Tac琀椀cs 1: Grow in Package Companies op琀椀mizing NDR have six levers to pull, three posi琀椀ve, and three nega琀椀ve. In this post, we look at the 昀椀rst of the posi琀椀ve levers. Managing Packaging Performance to Op琀椀mize SaaS To op琀椀mize Net Dollar Reten琀椀on (NDR) one needs to track package performance closely and op琀椀mize monthly. What should be tracked? What ac琀椀ons should be taken? How Pricing Can Help Fix NDR Challenges Net Dollar Reten琀椀on (NDR) or Net Revenue Reten琀椀on (NRR) is a key metric that investors are using to measure the health of their por琀昀olio companies. Pricing and packaging have a big impact on this metric, but not always in the ways one expects. How can pricing help improve NDR? PeakSpan & Ibbaka Net Revenue Reten琀椀on Research Report September 2023 46
Net Revenue Reten琀椀on (NRR) Impacts the Value of Your Company Net Revenue Reten琀椀on (NRR) or Net Dollar Reten琀椀on (NDR) will be a key way that B2B SaaS companies demonstrate their value to investors in 2023. Pricing will play a cri琀椀cal role in how companies improve NRR and NDR. As you price to improve NDR in 2023, plan for how this will posi琀椀on you in 2024. Pricing for Net Dollar Reten琀椀on (NDR) Over the past 6 months, we have seen many companies shi昀琀 their focus from ARR (Annual Recurring Revenue) to growing NDR (Net Dollar Reten琀椀on - also known as Net Revenue Reten琀椀on). How do you use the value and pricing levers to grow NDR? SaaS Capital 2023 SaaS Reten琀椀on Benchmarks for Private B2B Companies Net reten琀椀on and gross reten琀椀on benchmarks across all SaaS companies from research in 1H of 2023 Ibbaka Valio So昀琀ware pla琀昀orm for managing value and pricing PeakSpan & Ibbaka Net Revenue Reten琀椀on Research Report September 2023 47
Thank you PeakSpan & Ibbaka Net Revenue Reten琀椀on Research Report September 2023 49