

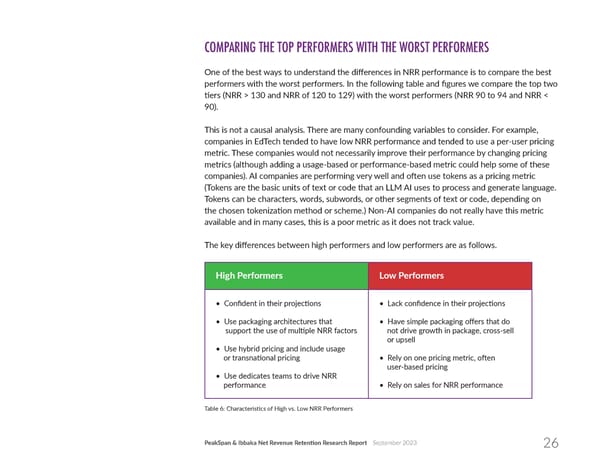
COMPARING THE TOP PERFORMERS WITH THE WORST PERFORMERS One of the best ways to understand the di昀昀erences in NRR performance is to compare the best performers with the worst performers. In the following table and 昀椀gures we compare the top two 琀椀ers (NRR > 130 and NRR of 120 to 129) with the worst performers (NRR 90 to 94 and NRR < 90). This is not a causal analysis. There are many confounding variables to consider. For example, companies in EdTech tended to have low NRR performance and tended to use a per-user pricing metric. These companies would not necessarily improve their performance by changing pricing metrics (although adding a usage-based or performance-based metric could help some of these companies). AI companies are performing very well and o昀琀en use tokens as a pricing metric (Tokens are the basic units of text or code that an LLM AI uses to process and generate language. Tokens can be characters, words, subwords, or other segments of text or code, depending on the chosen tokeniza琀椀on method or scheme.) Non-AI companies do not really have this metric available and in many cases, this is a poor metric as it does not track value. The key di昀昀erences between high performers and low performers are as follows. Table 6: Characteris琀椀cs of High vs. Low NRR Performers PeakSpan & Ibbaka Net Revenue Reten琀椀on Research Report September 2023 26
 Net Revenue Retention Page 25 Page 27